Feed
Overview
A Feed represents a source of (financial) events that can be (re-)played to feed a run() with data. Although the most common type of events are those containing market data, other types of events are also possible. For example, events containing news items or social media posts could also be represented as a feed.
The feed is the driver of the run-loop: it produces the Event objects that all the other components react to.
A Feed is also one of the main components that you swap when moving through the 4 stages of strategy development:
| Stage | Broker | Feed |
|---|---|---|
| Back Testing | SimBroker | Historical data |
| Forward Testing | SimBroker | Real-time data |
| Paper Trading | Real broker (paper account) | Real-time data |
| Live Trading | Real broker (real account) | Real-time data |
Feed API
The Feed interface itself is deliberately small and consists of just two abstract methods.
play(timeframe=None)— Returns an iterator of Event objects. Optionally, a Timeframe can be provided to only replay the events within that period. This is used for walk-forward and multi-run back tests.assets()— Returns the list of Asset objects that are contained in the feed.
feed = rq.feeds.YahooFeed("MSFT", "AAPL", start_date="2020-01-01")
print(feed.assets())
{Stock(symbol='AAPL', currency='USD', info=None), Stock(symbol='MSFT', currency='USD', info=None)}
Because a feed is an iterator of events, you can also play it manually. This is useful for debugging or for writing your own custom run-loop.
for event in feed.play():
    print(event.time, len(event.items))
    break
2020-01-02 05:00:00+00:00 2
Convenience methods
Most built-in feeds extend HistoricFeed, which adds a number of convenient helper methods on top of
the Feed interface:
symbols()— the list of unique symbols in the feed.get_asset(symbol)— retrieve an Asset by its symbol.get_ohlcv(asset)— the OHLCV values of an asset as a TimeSeries.to_timeseries(*assets)— prices of one or more assets as a multivariate TimeSeries.plot(asset)— plot the prices (and optionally trades) of an asset, requiresmatplotlib.count_events()/count_items()— quick statistics about the contents of the feed.track(metric)— track aMetricover time and return the result as a TimeSeries.
Feeds that keep everything in memory (like YahooFeed and CSVFeed) extend InMemoryFeed and
additionally provide:
timeline()— all unique timestamps in the feed.timeframe()— the Timeframe covered by the feed.get_first_event()/get_last_event()— the first and last event.
print(feed.timeframe())
print(feed.symbols())
[2020-01-02 05:00:00 ― 2026-09-30 04:00:00]
['MSFT', 'AAPL']
Historic Feeds
Historic feeds contain data that was recorded in the past and can be replayed for back testing. Roboquant ships with several built-in historic feeds, each with its own trade-offs in terms of data source, speed, and memory usage:
| Feed | Description | Price Items |
|---|---|---|
YahooFeed | Historic data retrieved from Yahoo Finance | Bar |
CSVFeed | Historic data parsed from one or more CSV files | Bar |
ParquetFeed | Historic data stored in a single Parquet file | Bar, Trade, Quote |
SQLFeed | Historic data stored in an SQLite database | Bar, Quote |
RandomWalk | Synthetic data generated by a random-walk model | Bar, Trade, Quote |
YahooFeed
YahooFeed retrieves historic market data from Yahoo Finance. It is free to use and does not require
an API key. By default, it retrieves daily bars, but you can specify a different interval.
feed = rq.feeds.YahooFeed("TSLA", "MSFT", start_date="2015-01-01", interval="1d")There is also a convenience factory method us_stocks_10() that returns a feed with 10 large US
stocks (MSFT, NVDA, AAPL, AMZN, META, GOOGL, AVGO, JPM, XOM, TSLA). Handy for quick experiments,
but note that this selection has a strong survivor bias.
feed = rq.feeds.YahooFeed.us_stocks_10(start_date="2020-01-01")CSVFeed
CSVFeed parses one or more CSV files with historic market data. By default it expects the Yahoo
Finance column layout, but this can be customized via the columns parameter. The symbol is derived
from the filename.
feed = rq.feeds.CSVFeed("path/to/csv/dir")There are also ready-made class methods for specific formats, such as stooq_us_daily(),
stooq_us_intraday(), and yahoo(). An optional asset_filter allows you to load only a subset
of the assets in the files.
ParquetFeed
ParquetFeed reads historic data from a single Parquet file. Parquet provides a good balance between
speed, memory usage, and disk usage, which makes it a great option to store large volumes of historic
market data for back testing. It supports a mix of Bar, Trade, and Quote price items.
Use the record() method to copy data from any other feed into a ParquetFeed:
from roboquant.feeds.parquetfeed import ParquetFeed

feed = rq.feeds.YahooFeed("MSFT", "AAPL", start_date="2020-01-01")
target = ParquetFeed("data.parquet")
target.record(feed)
A demo file with 10 years of data for 10 popular US stocks is available through us_stocks_10().
This is included for demo purposes and should not be relied upon for serious back testing.
SQLFeed
SQLFeed supports recording price items from another feed and then playing them back during a run.
Under the hood, the data is stored in an SQLite database. The schema is created automatically when
the first item is recorded, and it differs for Bar and Quote items, so you can only store one
type of price item in a single database.
feed = rq.feeds.SQLFeed("my_data.db", price_type="bar")Use the record() method to copy data from another feed into the database. For large databases, you
can call create_index() after all data has been recorded to speed up queries for specific timeframes
(e.g. in walk-forward back tests).
RandomWalk
RandomWalk is a synthetic feed that simulates a random walk of prices. It can generate Bar,
Trade, or Quote price items and is very useful for testing and for building examples without
needing an internet connection.
feed = rq.feeds.RandomWalk(n_assets=5, n_events=1_000, price_type="trade")
assets = feed.assets()
asset = next(iter(assets))
feed.plot(asset, plot_volume=False);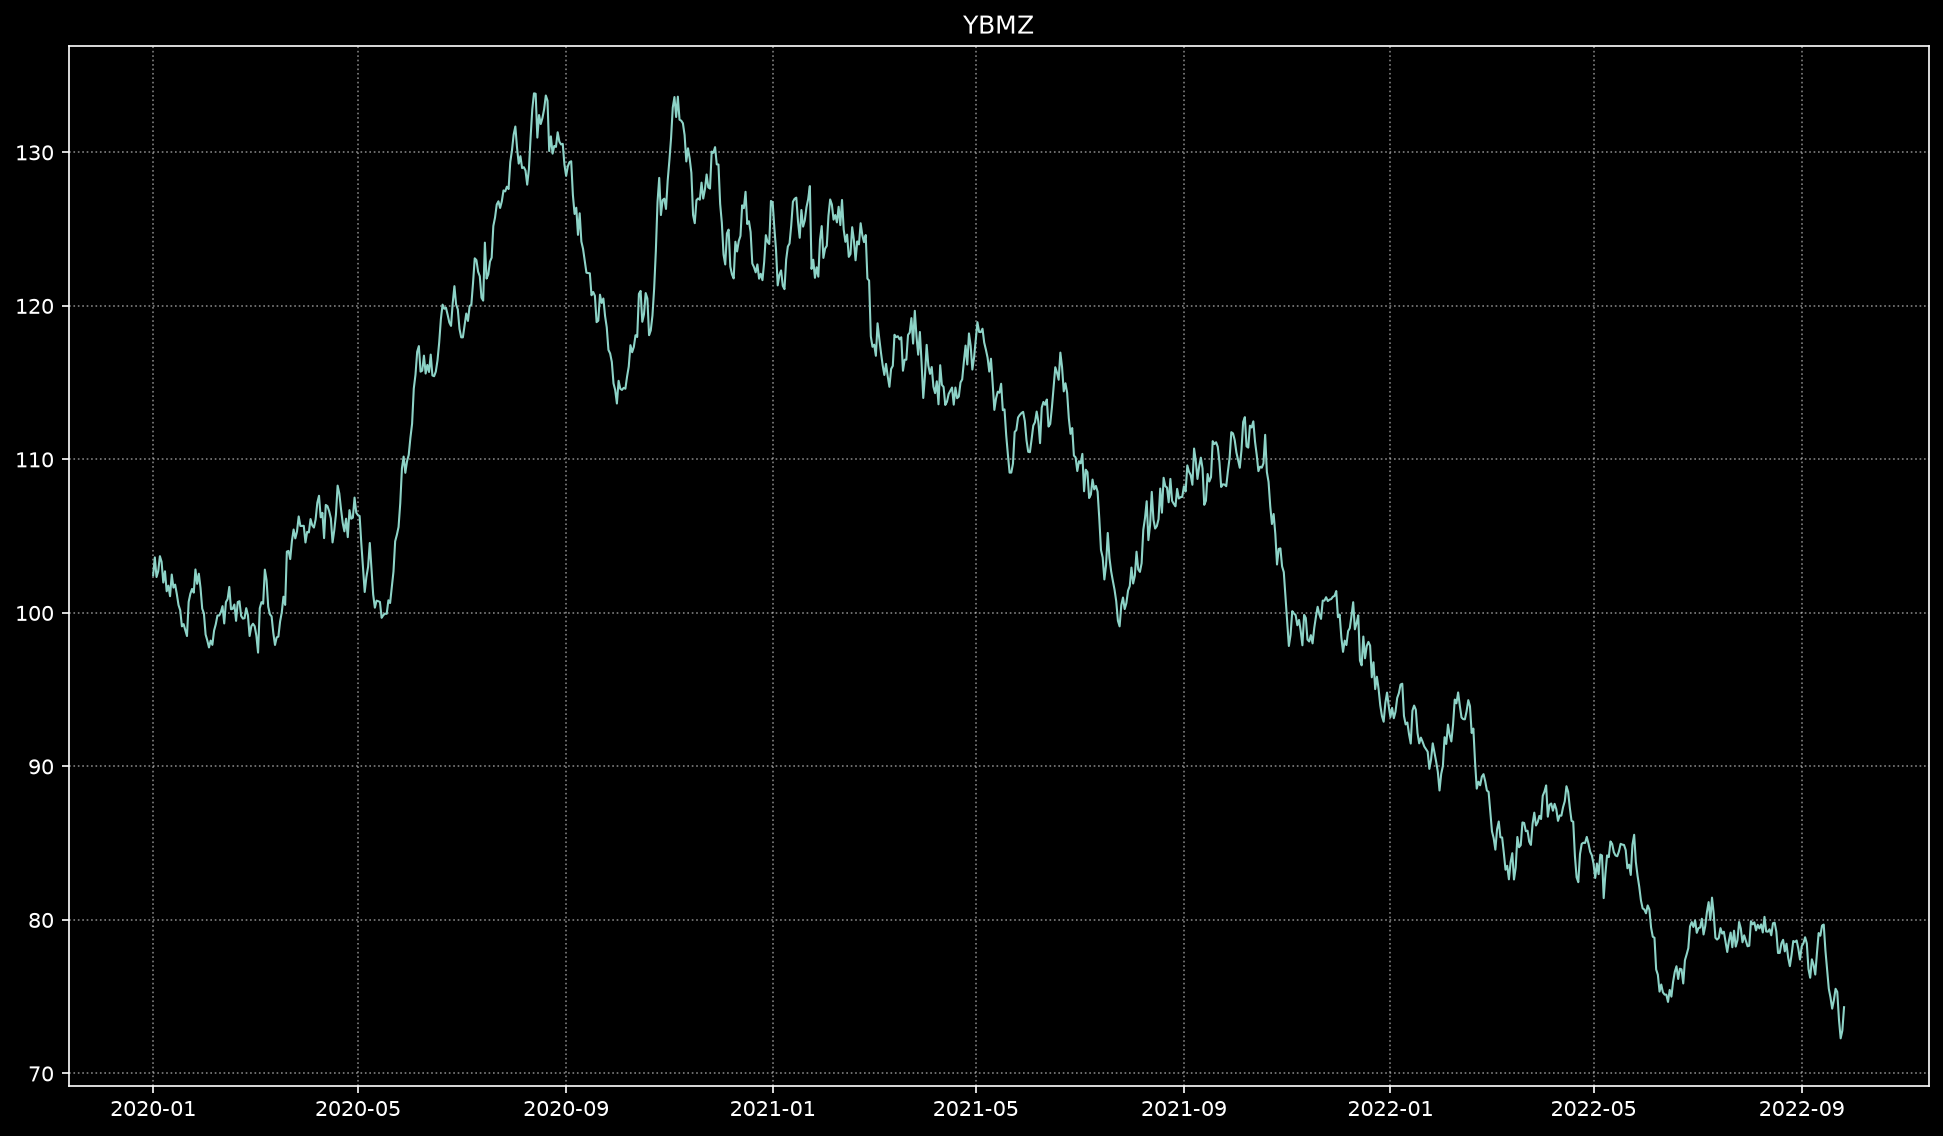
Feed Transformations
Feeds can be wrapped by other feeds to transform the data they produce. This is a powerful way to adapt a data source to the needs of a strategy.
BarAggregatorFeed
BarAggregatorFeed aggregates the Trade or Quote items of another feed into Bar items of a
given frequency. When trades are selected, the actual trade prices and volumes are used. When quotes
are selected, the midpoint prices are used and volumes are not available.
trades = rq.feeds.RandomWalk(n_assets=2, n_events=10_000, price_type="trade")
bars = rq.feeds.BarAggregatorFeed(trades, frequency="15m", price_type="trade")TimeGroupingFeed
TimeGroupingFeed groups events that occur closely after each other into a single event. It uses the
timestamps of the events to determine if they are close, based on a configurable timeout. This can be
useful to reduce the number of events when working with a chatty data source.
trades = rq.feeds.RandomWalk(n_assets=2, n_events=10_000, price_type="trade")
feed = rq.feeds.TimeGroupingFeed(trades, timeout=5.0)
Live Feeds
For forward testing, paper trading, and live trading you need a feed that produces real-time data
instead of replaying historic data. The abstract LiveFeed base class implements this and provides
two guarantees for the events it publishes:
Monotonic timestamps — if a new event has a timestamp before or equal to the previous one, it is automatically corrected so that events always increase in time.
Heartbeats — if no event is received within a configurable timeout, an empty heartbeat event is emitted so the run-loop keeps ticking.
Live feeds are typically paired with a live broker. Concrete implementations for specific brokers
(e.g. Alpaca) can be found in the roboquant.third_party module.