Intro
Charts in roboquant are all based on matplotlib. Either by directly invoking methods or via the Pandas dateframe plot method.
Using matplotlib for trading charts brings several benefits:
Mature & battle-tested —
matplotlibhas been the go-to Python plotting library for over two decades, with a vast ecosystem of tutorials, extensions, and community support.Full control over every visual element — you can customize tick labels, grid lines, annotations, legends, and layouts down to the pixel, which is essential when you need to highlight specific trade signals or events.
Seamless Pandas integration — price and trade data naturally lives in
pandasDataFrames, andmatplotlibcan plot directly from them with a single.plot()call.Multiple export formats — charts can be saved as PDF, PNG, SVG, or EPS, making them suitable for inclusion in research papers, reports, or presentations.
Jupyter-native — charts render inline in notebooks, enabling fast, iterative exploration of backtest results without leaving the development environment.
Extensibility — if you ever need candlestick charts or more advanced financial visualizations, libraries like
mplfinancebuild directly on top ofmatplotlib.
Styles
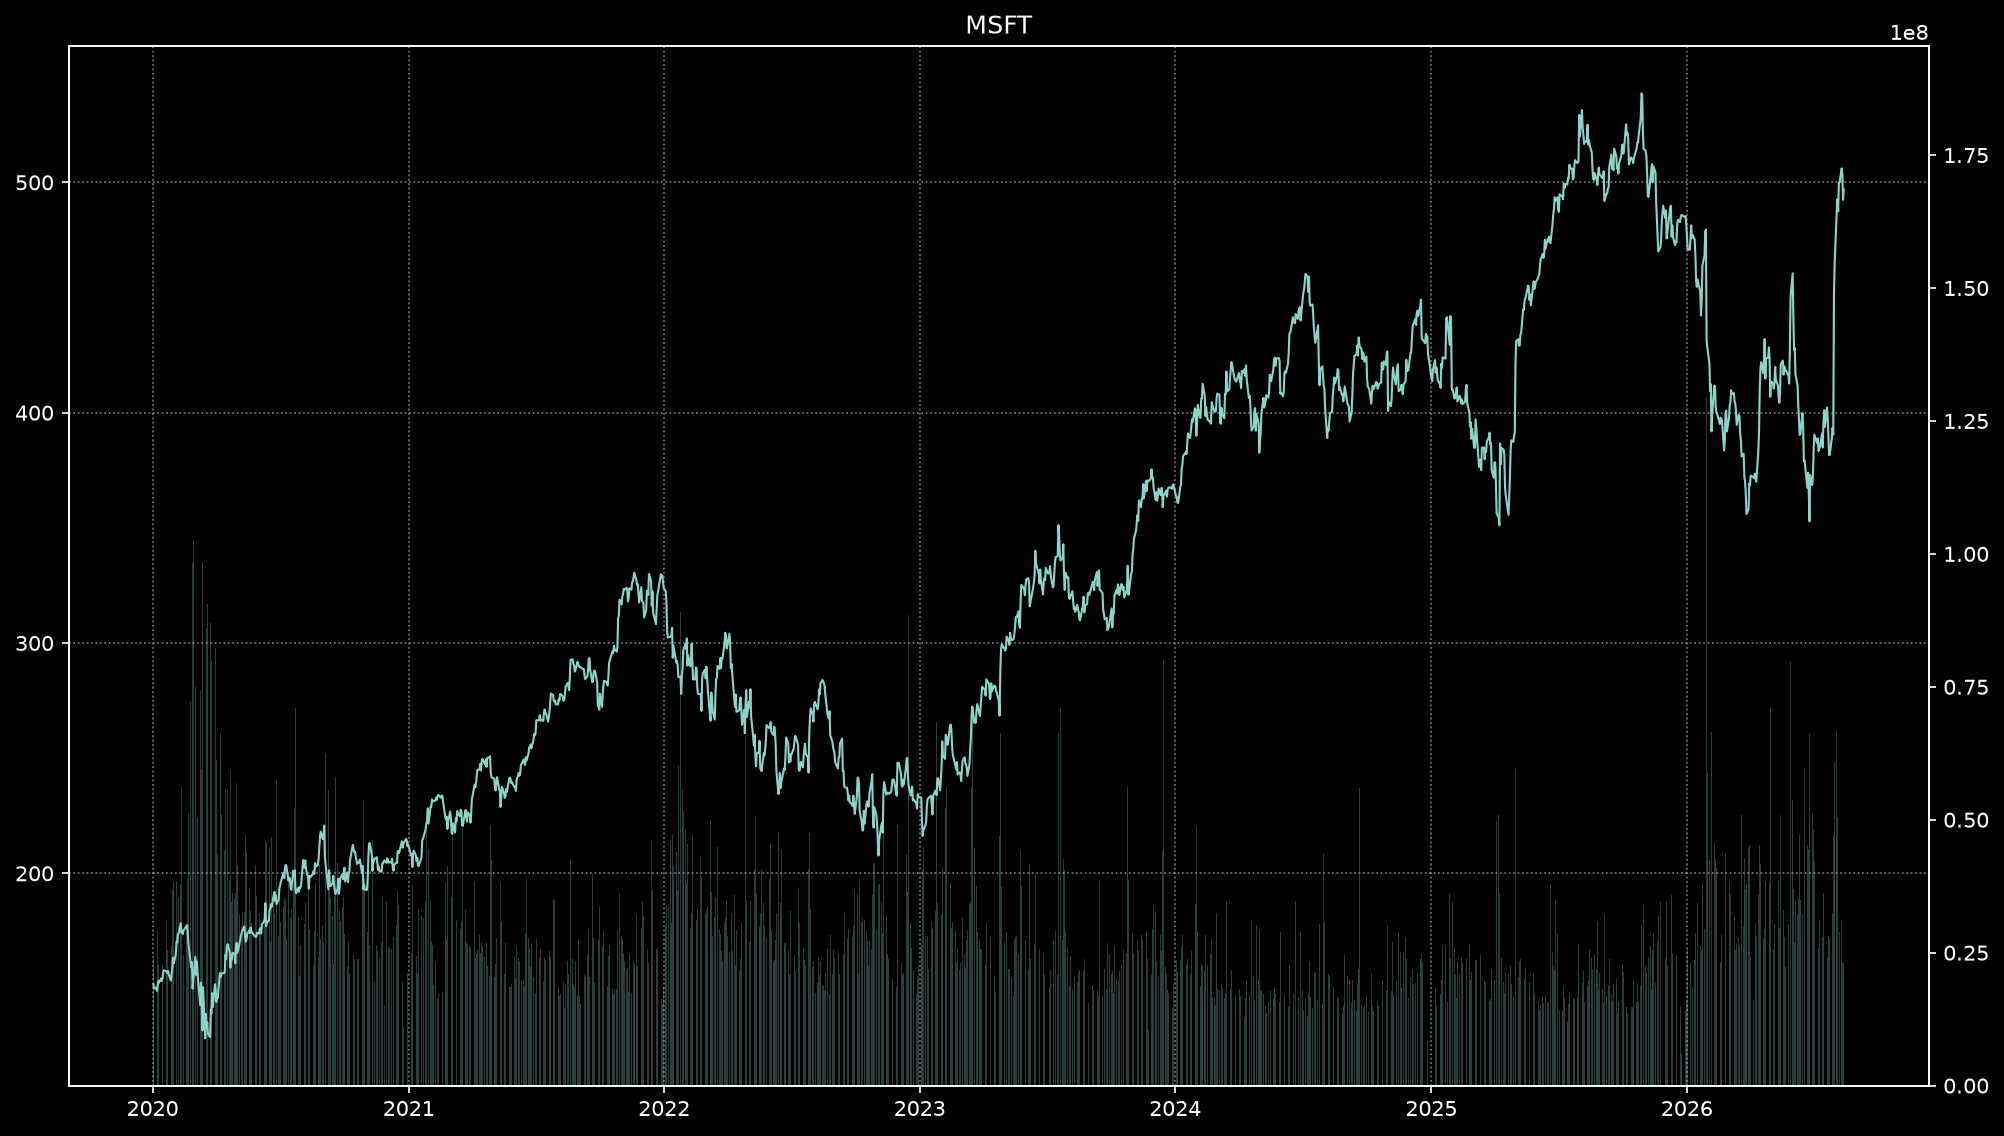
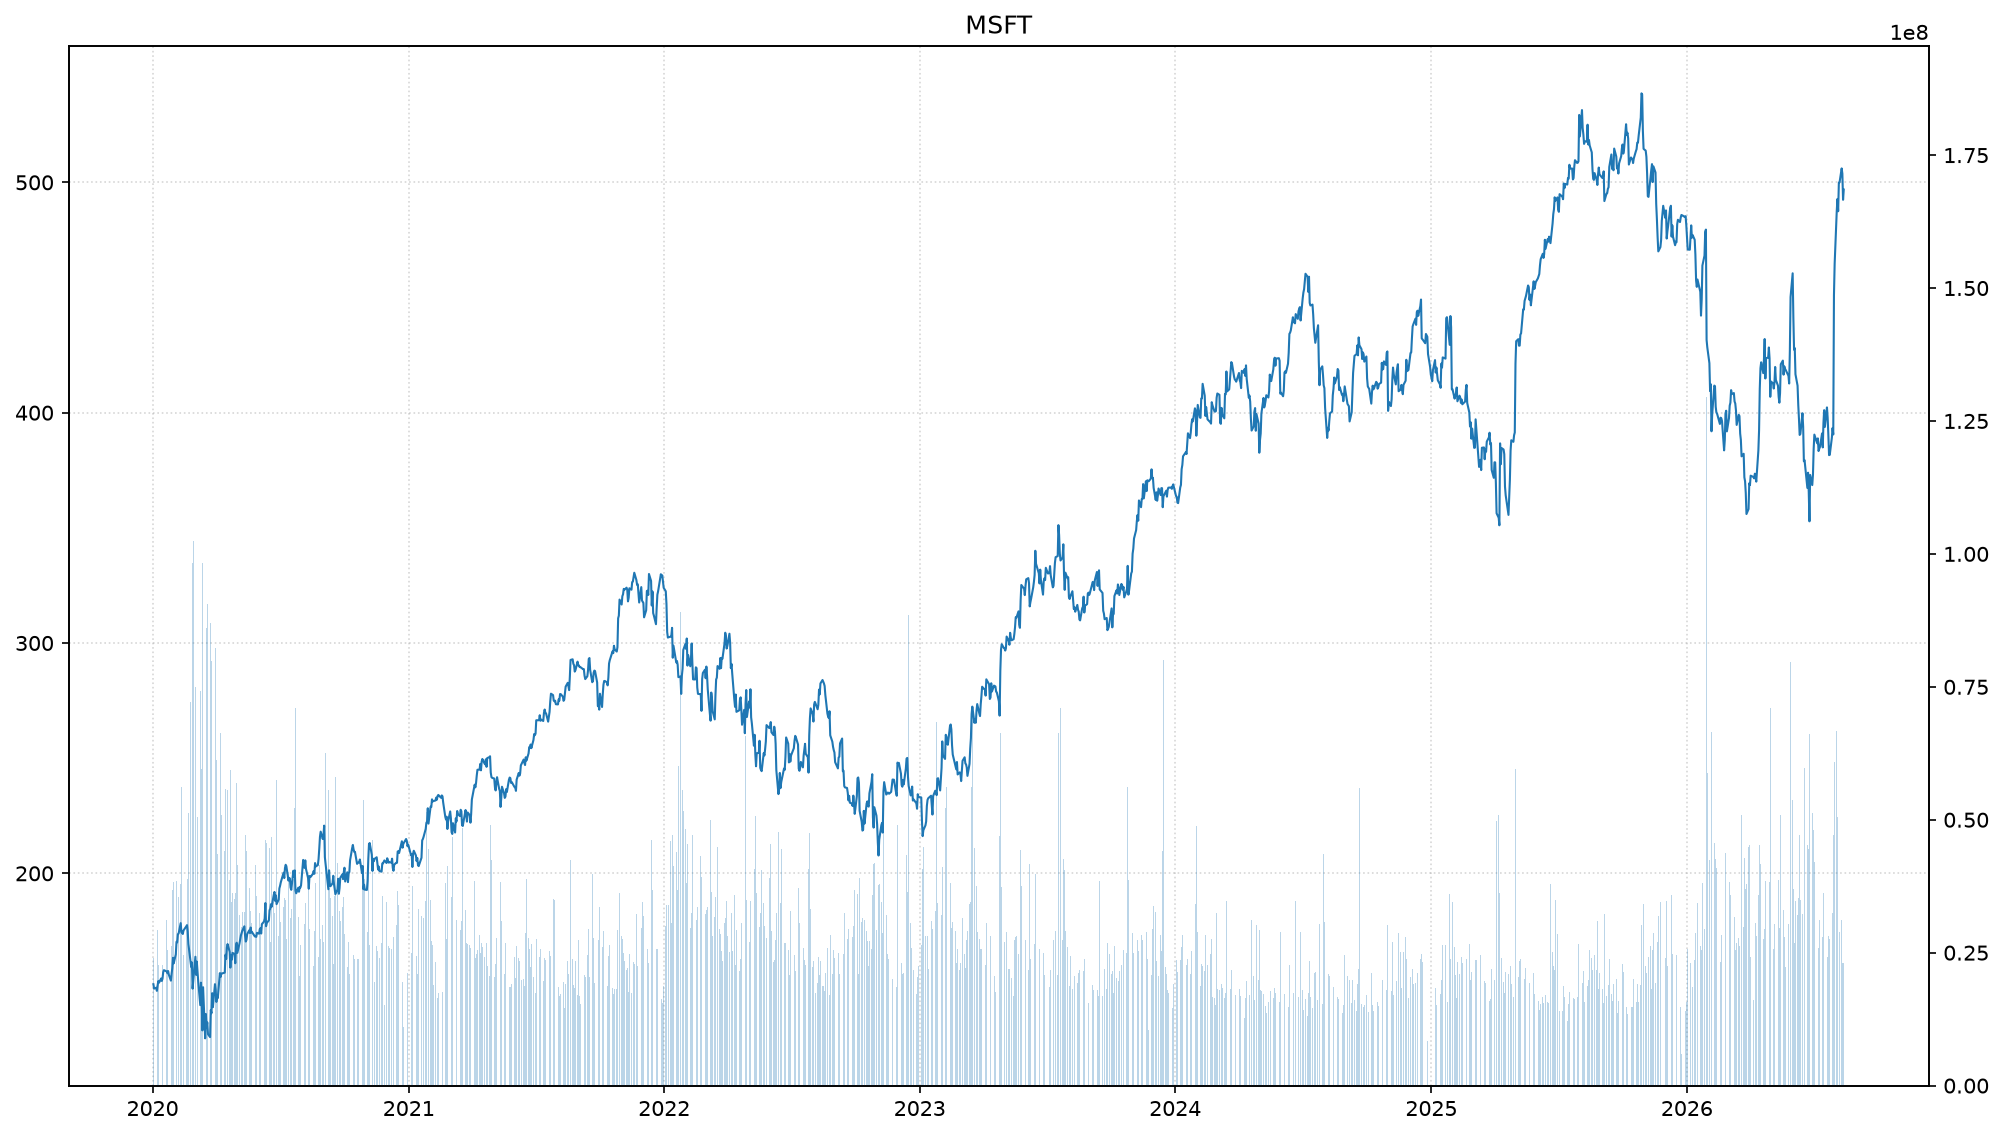
Roboquant has a light and dark style for the charts, which can be enabled by calling the set_dark_style() and set_light_style() function.
Besides the dark background, it also sets some other parameters for the charts, like the figure size, dpi and grids.
import roboquant as rq

rq.set_light_style()
rq.set_dark_style()
The following charts shows these two styles in action.
Light style
Great for exporting to PDF and printing.
Dark style
Great for developing late at night or in a dark mode editor.